We look at the weather forecast to see if we need to take a jacket to ensure we stay warm and dry. We look at Google Maps to check driving routes in rush hour to find the quickest route. We look at the odds of our favourite horse winning before we decide to place a bet. Analysts globally rely on insights and mathematical calculations to make predictions that are then shared with citizens so they can make informed decisions about what’s best for them. RiskScape is a tool that offers these calculations based on natural disaster events. By having a deeper understanding of the impact of events like tsunamis, volcanic eruptions, earthquakes and more, both government and the general population can better prepare themselves for the worst case and mitigate the risk.
How RiskScape works
RiskScape helps you understand and navigate risks by transforming hazard data into actionable insights, like when the Hunga Tonga–Hunga Ha‘apai volcano erupted in Tonga(external link), RiskScape could identify the worst impacted areas for emergency response planning. Anyone can use RiskScape, but typically it is used by governments, emergency management departments and councils to better plan how to protect their regions. Additionally, insurers may use RiskScape to predict the impact and number of insurance claims in the event of different scenarios. To use RiskScape, data is gathered and input to build a RiskScape model. The model is then 'run' to calculate the consequences of natural hazards for people, buildings, infrastructure, and the environment through risk analysis.
Another example of how RiskScape works is where the tool was used to plan the response to Cyclone Gabrielle in the days leading up to the storm. During the events, scientists added rainfall data to give estimates of impacts and highlight areas of particular risk.
1. Building a risk model
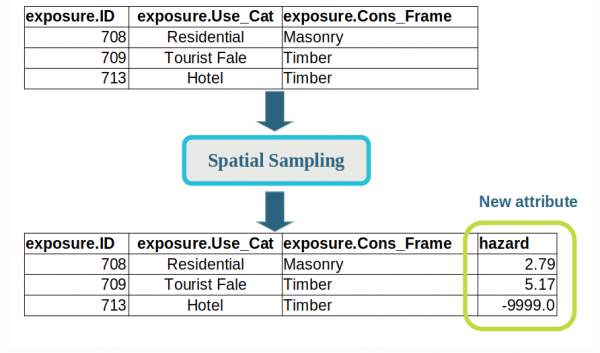
A screenshot of spatial data comparing residental types and construction materials.
Your RiskScape model determines the risk by combining the following:
- Hazard: the event or events that you want to measure the impact of, such as a flood, earthquake, or tsunami.
- Exposure: the elements within your geospatial data that could be exposed. For instance, houses, hospitals, people, and schools.
- Vulnerability: how the hazard interacts with your exposure elements. For example, how much ground shaking is required to cause damage to or to destroy buildings of different construction types?
RiskScape accurately models the impacts of hazards on roads, power lines and larger areas such as farms and forests because it accepts such a range of data points (points, lines, and polygons). RiskScape is not the only geospatial tool on the market – however, other models represent a building or property by a single point only. Ultimately, this leads to a more disjointed forecast and a less accurate model.
The RiskScape team (a collaboration between Catalyst, NIWA, and GNS Science) can support building your risk models by developing and providing the hazard data. Outsourcing your risk modelling to the RiskScape team also means you have a myriad of industry-leading data scientists, environmental scientists, and software engineers providing you with trustworthy and reliable models.
2. Types of modelling
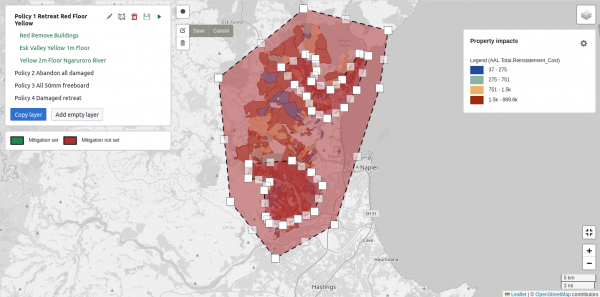
A microsite from RiskScape displaying a map of flooding by the Ngaruroro River and what buildings would be the most exposed.
RiskScape enables you to run different modelling types and risk analyses, including:
- Hazard exposure: what is the intensity of the hazard at locations we are interested in?
- Scenario impact: also known as deterministic modelling, provides the results for a single event such as a M7 earthquake in Wellington.
- Probabilistic: uses hundreds or even millions of possible hazard scenarios. RiskScape can calculate the likelihood of catastrophic events in the next 50,100, 250 or 500 years. It will then calculate the average loss over the period modelled to get you the Average Annual Loss, the cost of the damage you can expect each year.
Additionally, RiskScape supports multi-hazard risk analysis either:
- Simultaneous – modelling both the flooding depth and flow rate or
- Cascading - such as an earthquake causing tsunamis and landslides.
So, rather than using a specific tool for a singular problem like a drought, RiskScape’s flexibility enables you to gain insights and plan for numerous scenarios. It calculates every feature exposed in your data, from apartment blocks to the garden shed. You can then accurately aggregate these results to your needs, whether it's a property, suburb, city, region or on a national scale.
Plan for the future of your communities
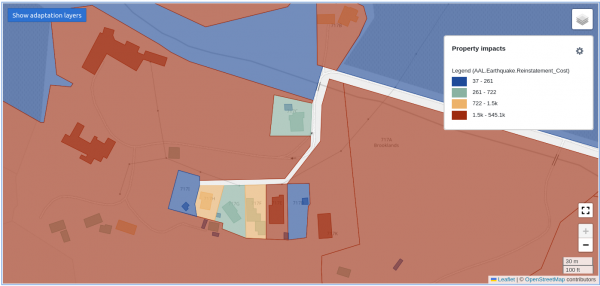
Impacts of earthquakes calculated to individual buildings then summed to property parcels.
As severe weather and climate change ramp up the risk of more intense weather, where we decide to live and develop has higher consequences. What may be acceptable for now could be costly in the future. By using RiskScape for different scenarios, we can look into the future and see what risk we are exposing our future selves to.
For example, consider an urban area slated for more intensive development that is also at risk for coastal flooding. We can explore what might happen over the next 100 years with rising sea levels under several alternative scenarios:
- Keeping the buildings static and not developing any new builds.
- Allowing for 20% more building intensification.
- Creating an avoidance zone, maintaining it as static, and permitting building only in safe areas.
- Retreating from the highest-risk areas and intensifying development in other regions.
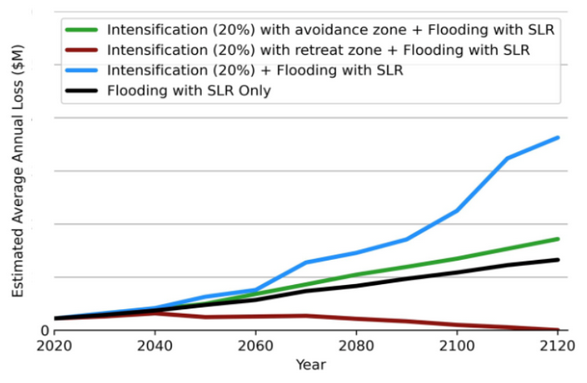
RiskScape results for a coastal flooding model showing the impacts of different planning decisions. From this we can see that the current policy (blue line) is leading to increased risk for the community. The red line shows that retreating from high risk areas and allowing intensification in safe areas leads to a lower overall risk in 100 years than the current exposure.
Because of this unique flexibility for risk modelling, RiskScape can better inform land-use planning decisions, better protect the population, and provide more calculated investments for councils.
Plus, as population and construction numbers change, your input data will also need to be updated. Instead of developing a new model each time, RiskScape enables you to simply re-upload the new data and rerun your model to obtain updated metrics and insights.
Global RiskScape training
Photo of the RiskScape team at UR2024 in Japan. Pictured left to right Russel Garlick (Catalyst), Helen Barnes, Faye Nielsen, Christina Magill and Josh Hayes (GNS Science.))
In June, our RiskScape team at Catalyst joined GNS Science for the Understanding Risk 2024 Conference (UR24)(external link) in Japan. The conference is a place to bring together Disaster Risk Management (DRM) experts and practitioners worldwide to share and learn about technology and risk innovation. Russel and Tim from our RiskScape development team attended the week-long event and ran a workshop training attendees on how to use the newly developed RiskScape Platform. The platform provides a way to run and collaborate on RiskScape projects leveraging dynamically managed engine instances in the cloud. It also provides a base for building tailored microsites for a wide range of users to view RiskScape results and define, run and compare scenarios without advanced programming skills. We have run global training in person and online so countries are equipped with the relevant skills and experience to use RiskScape.
If you’re interested in RiskScape training, configuring your model, or learning more, contact our RiskScape team.
Getting started with RiskScape
Developed by GNS Science(external link), NIWA(external link), Catalyst and the Natural Hazards Commission(external link), RiskScape is a powerful risk calculator founded in Aotearoa, New Zealand and can be used globally for natural disaster planning to build resilience.
The RiskScape Engine, which underpins every RiskScape model, is an open source command-line tool. Download the RiskScape Engine. However, to use the RiskScape Engine, you should be comfortable using the command line and have a basic understanding of geospatial data and risk analysis.
On top of the RiskScape Engine is the RiskScape Platform which provides a much simpler web-based interface to running risk analysis. If you’re unfamiliar with geospatial data, we recommend outsourcing your needs to ensure you have an accurate model and trusted data for decision-making. If you want to find out more about using the RiskScape Platform, contact our RiskScape team for support.